NEW · REPLAY LIVE: A CISO's Guide to Proving Agentic AI Governance
Watch
For Risk Officers
Know your AI risk in plain numbers.
Boards want a straight answer: how exposed are we? Trinitite gives you a live score and the story behind it.
Your Problem
Sound familiar?
01
No single place to see all your AI risk. Data lives in ten tools and none of them talk to each other.
02
Risk reports come from surveys and guesses — not real data. By the time you finish, the picture is already old.
03
The board asks "how exposed are we?" and you have no number to give them.
What You Get
Real risk numbers, not guesses
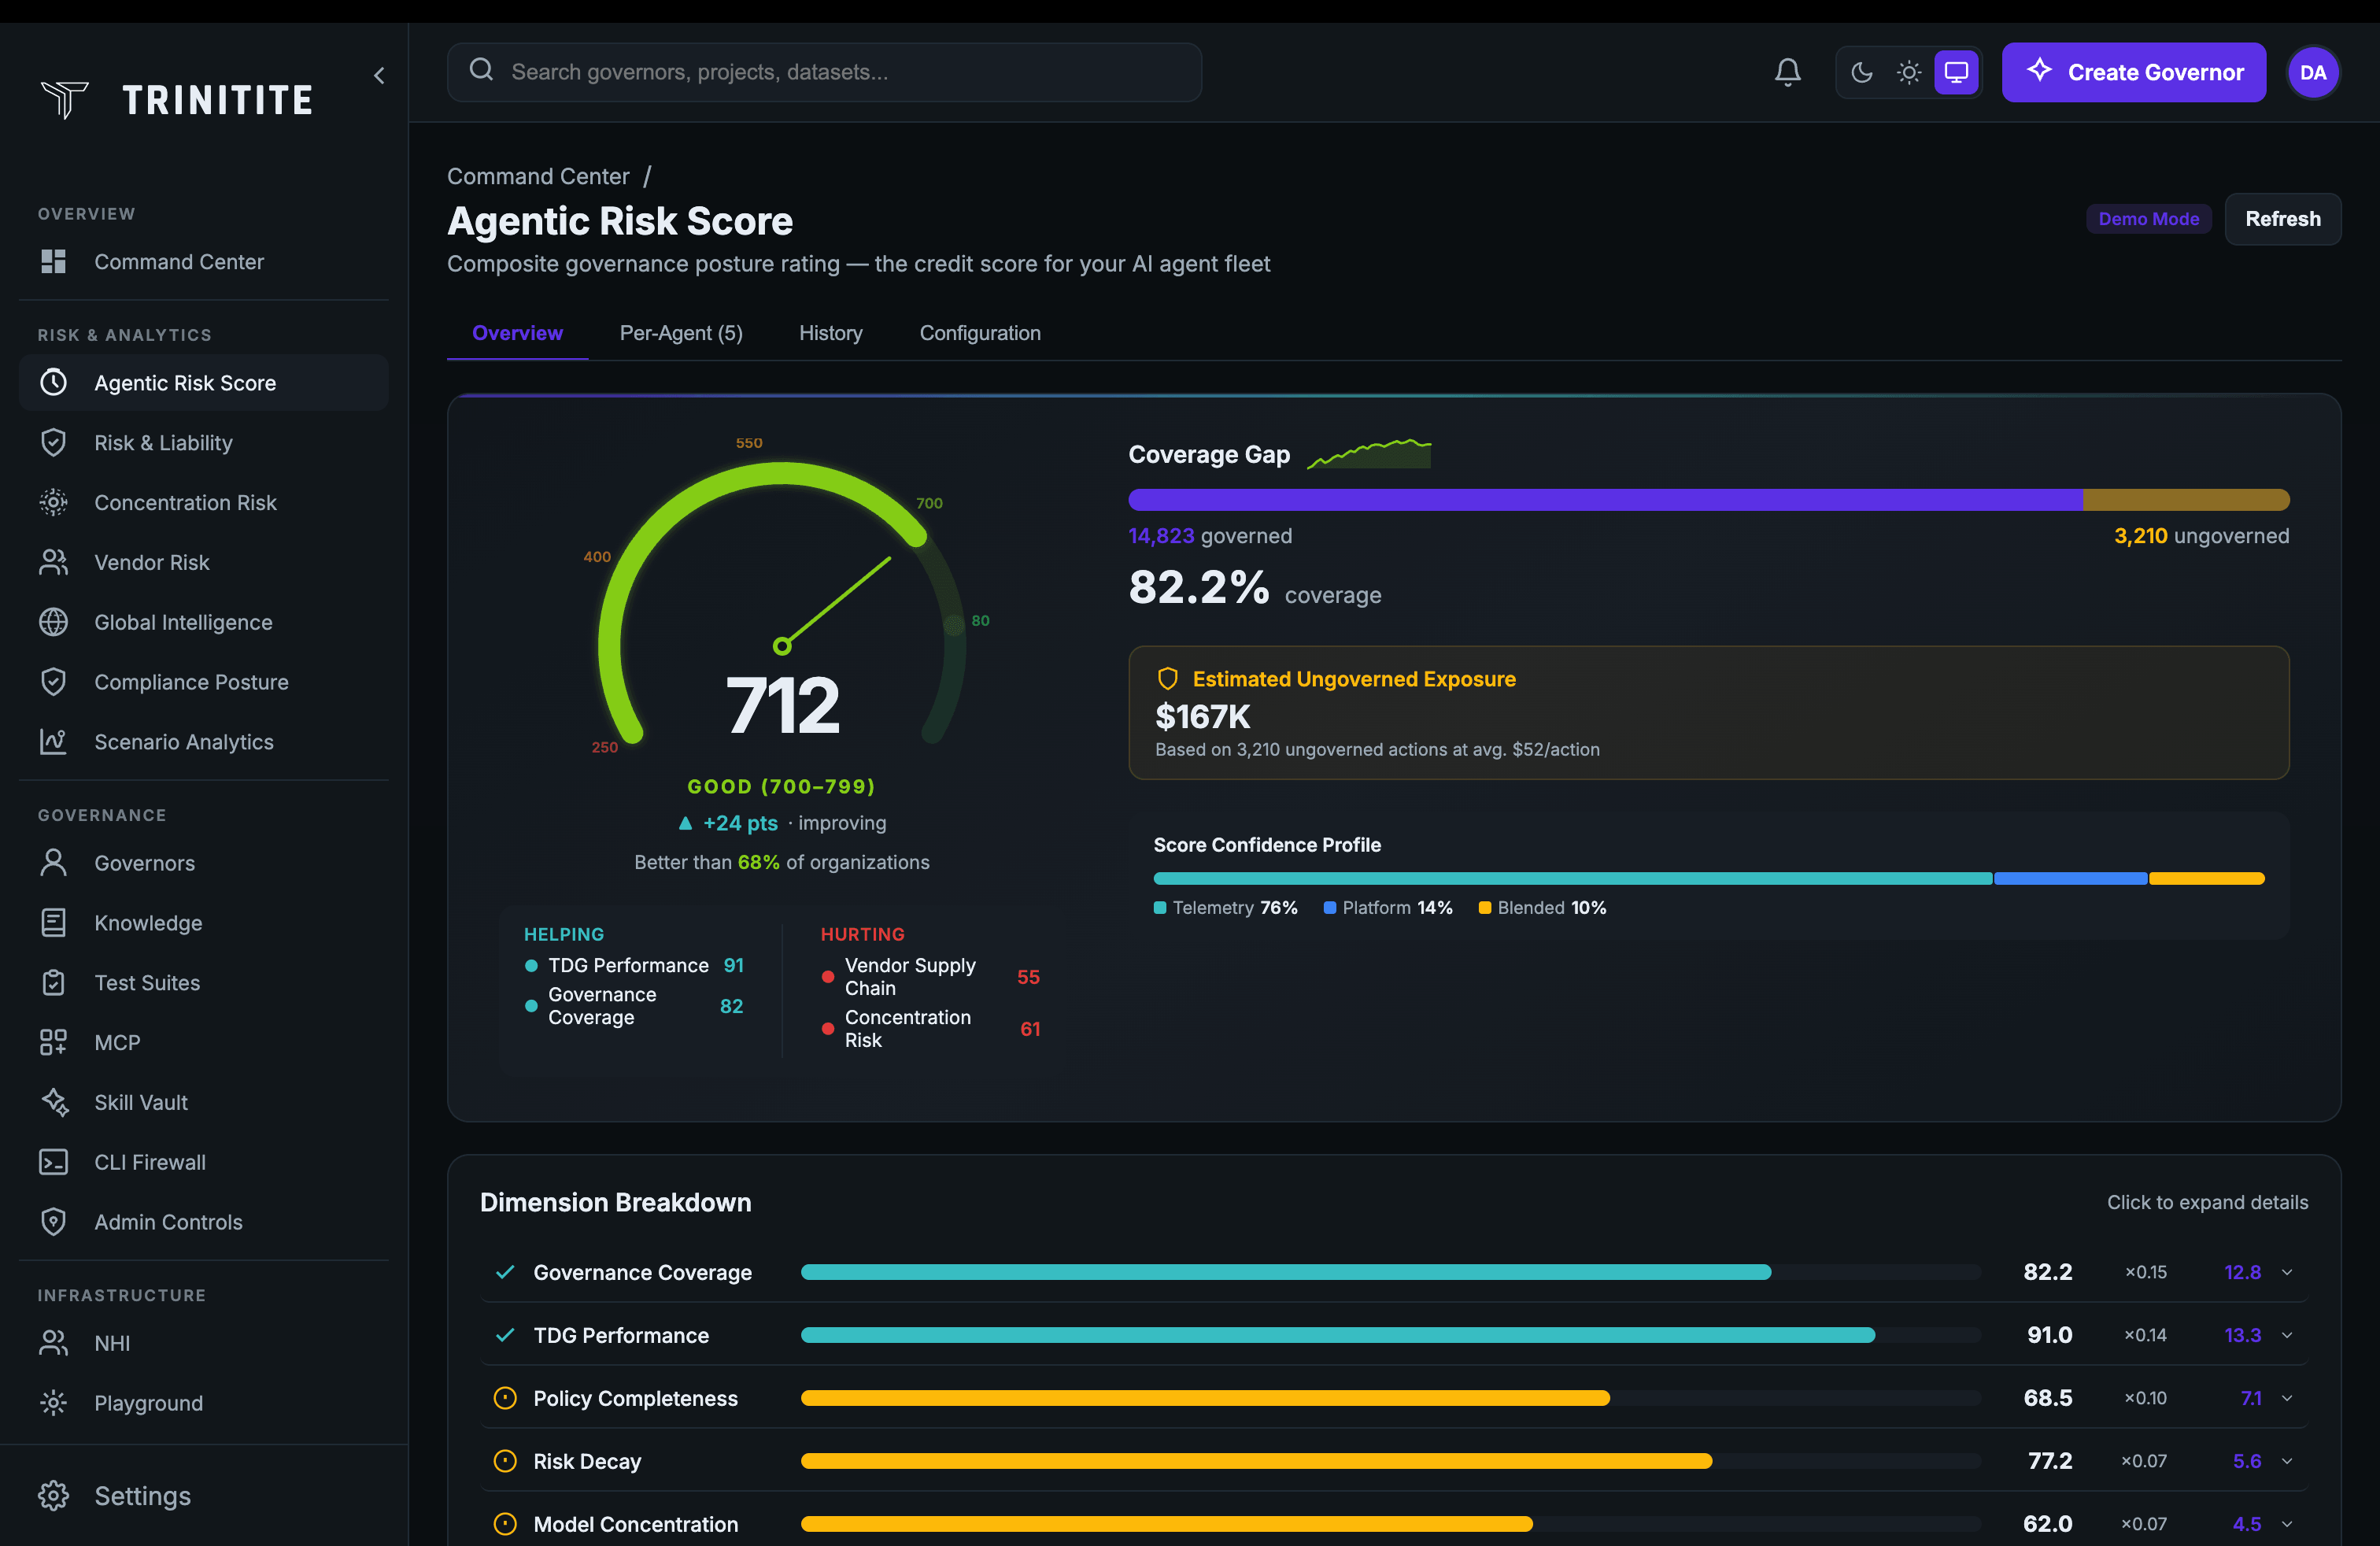
Live Agentic Risk Score
One number from 250 to 1,000 that tells the board exactly where you stand. It updates as your AI agents work — not once a quarter.
CRITICAL (250–399)
Composite governance posture
Monte Carlo Loss Modeling
We run 10,000 "what if" scenarios. You see the most likely loss, the worst case, and where the biggest gaps are.
Monte Carlo Simulation — 10,000 Scenarios
Expected Annual Loss
$0
VaR (95%)
$0
CVaR (Tail Risk)
$0
Breach Probability
0.0%
Loss Distribution by Percentile
$0
P10
$0
P25
$0
P50
$0
P75
$0
P90
$0
P95
$0
P99
Mean
VaR 95%
Tail Risk
Markov Risk States
Watch how your agents move between safe, risky, and critical states over time. Spot trouble before it arrives.
Markov Risk State Model
30-Day State History
Risk Taxonomy Mapping
Every risk is sorted into a clear map. You see which areas are covered, which have gaps, and what to fix first.
Risk taxonomy
Live violation mapping
PII
SSN Exposure
High
142 events
Credit Card Leak
High
89 events
Medical Data
Medium
56 events
Email Addresses
Low
203 events
Financial
Unauthorized Commitment
High
34 events
Pricing Disclosure
Medium
67 events
Refund Override
Medium
21 events
Compliance
GDPR Violation
High
48 events
HIPAA Breach
High
12 events
Regulatory Filing
Low
5 events
Security
Access Control Bypass
High
91 events
Credential Leak
High
38 events
Audit Tampering
Medium
7 events
Provider Blast Radius
Simulate a provider going offline and see the cascade: financial exposure, affected systems, and governance coverage loss — modeled before it happens.
Provider Blast Radius — What-If Simulator
OpenAI
0%
14 systems
Anthropic
0%
8 systems
0%
5 systems
Mistral
0%
3 systems
See It In Action
Your risk score, live
This is what the board sees. One number. Clear color. Updated every second.
Provider concentration (HHI)
2,450
Moderate
0
10,000
Diversified (0–1,500)
Moderate (1,500–2,500)
Concentrated (2,500–5,000)
Monopolistic (5000+)
Dependency breakdown
OpenAI
45%
Anthropic
30%
Internal LLM
15%
10%
Financial exposure
$2.4M annual impact
What if OpenAI becomes unavailable?
87
Risk Decay Score
8
Dimensions Tracked
$4.2M
Risk Quantified
Board-ready
Reporting
Stop guessing. Start measuring.
Thirty minutes against your real agent fleet. Leave with an Agentic Risk Score and a board-ready exposure model in dollars.
Trinitite
AI governance that catches mistakes, proves compliance, and shows the board what it saved—in dollars.
Product
Solutions
© 2026 Fiscus Flows, Inc. · All rights reserved
Accessibility
The Guardian Standard™