NEW · REPLAY LIVE: A CISO's Guide to Proving Agentic AI Governance
Watch
For Insurers & Underwriters
Price AI risk using real data. Not guesses.
You can't price what you can't see. Trinitite shows what actually happens when AI runs — so your rates match real risk.
Your Problem
Sound familiar?
You price AI coverage on faith — not facts.
There is no structured loss data for AI failures.
You can't tell a careful company from a careless one.
What You Get
Real numbers. Real risk.
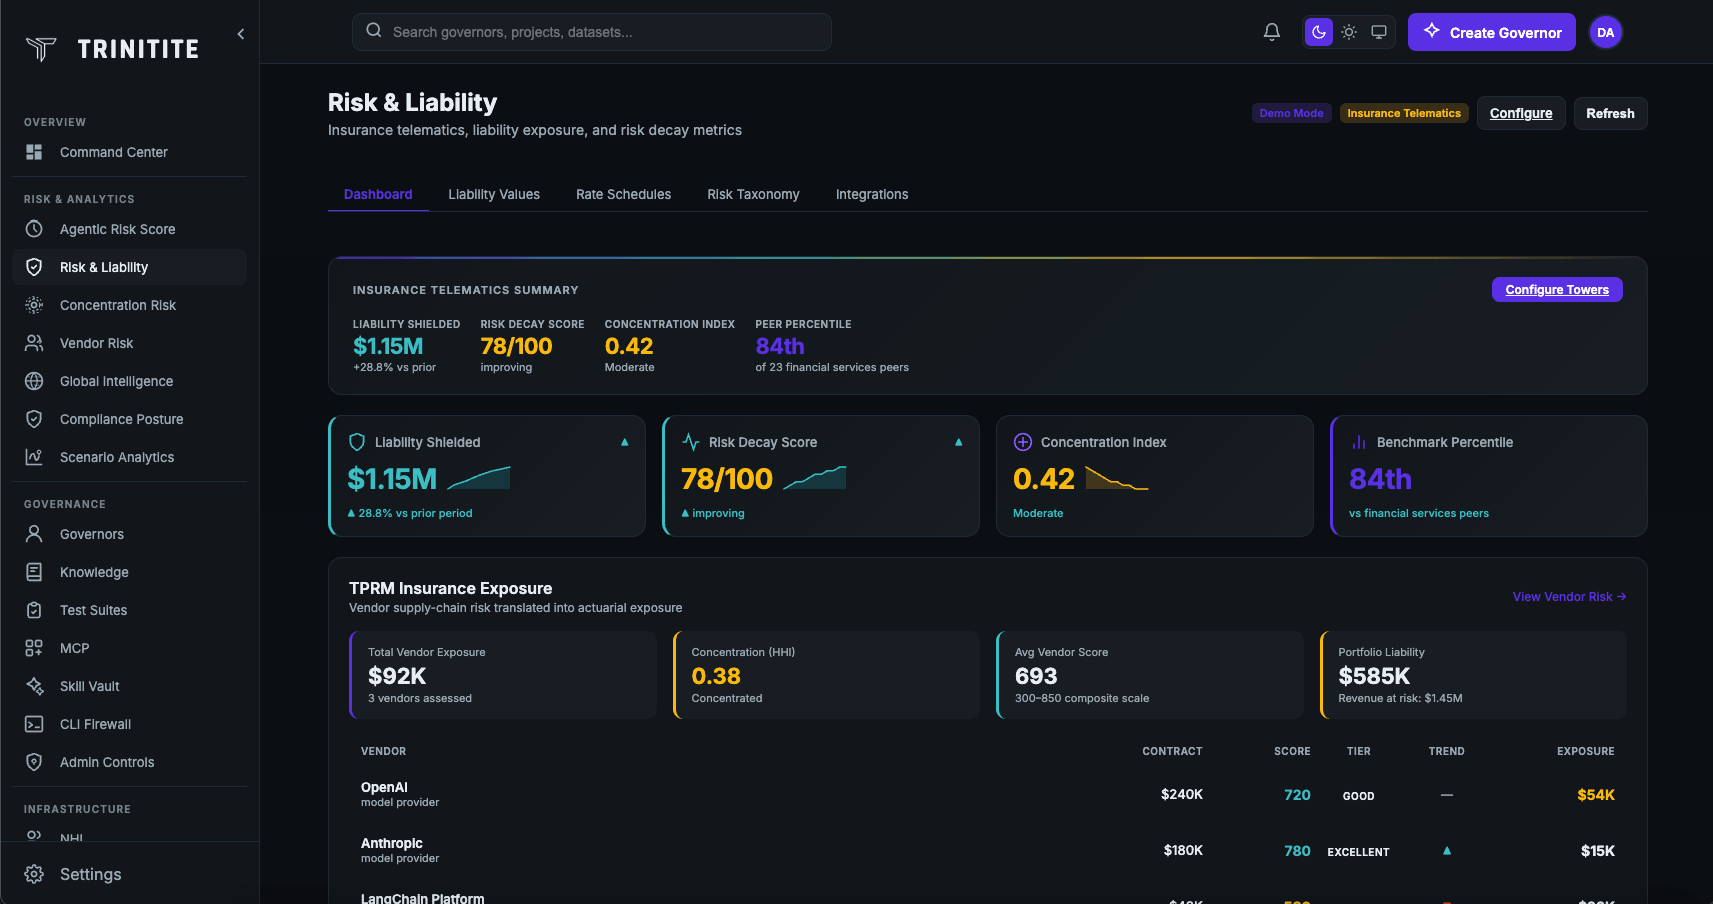
Insurance Tower Analytics
See policy layers stacked against real risk. Find the gaps between what is covered and what is exposed — before a claim lands.
Insurance Tower Analytics
Aggregate Stop-Loss
Limit: $5.0M
Claims utilized
$0
0%
Excess / Stop-Loss
Limit: $1.0M
Claims utilized
$0
0%
Self-Insured Retention
Limit: $250K
Claims utilized
$0
0%
Liability Prevented
$0
Governance kept this from becoming claims
Claims Avoided
0
Premium Impact
$0
Distance to SIR
$93K
Monte Carlo Loss Modeling
Run 10,000 scenarios of what could go wrong. Get expected losses, worst-case numbers, and the odds of a big hit.
Monte Carlo Simulation — 10,000 Scenarios
Expected Annual Loss
$0
VaR (95%)
$0
CVaR (Tail Risk)
$0
Breach Probability
0.0%
Loss Distribution by Percentile
$0
P10
$0
P25
$0
P50
$0
P75
$0
P90
$0
P95
$0
P99
Mean
VaR 95%
Tail Risk
Vendor Risk Portfolio
Compare AI vendors side by side. See which ones have strong controls and which ones carry hidden risk.
Vendor Risk Portfolio
Critical
OpenAI
782
Anthropic
745
AWS Bedrock
698
Internal LLM
534
Provider Blast Radius
Simulate any AI provider going down. See the financial exposure, affected systems, and governance coverage loss — the what-if insurers need.
Provider Blast Radius — What-If Simulator
OpenAI
0%
14 systems
Anthropic
0%
8 systems
0%
5 systems
Mistral
0%
3 systems
Concentration Risk for Underwriting
Quantify systemic exposure to AI providers and models — so premiums reflect concentration, not just individual app risk.
Provider concentration (HHI)
2,450
Moderate
0
10,000
Diversified (0–1,500)
Moderate (1,500–2,500)
Concentrated (2,500–5,000)
Monopolistic (5000+)
Dependency breakdown
OpenAI
45%
Anthropic
30%
Internal LLM
15%
10%
Financial exposure
$2.4M annual impact
What if OpenAI becomes unavailable?
Structured Loss Data
Machine-readable, dollar-valued violation records you can feed into actuarial models — not anecdotes in a slide deck.
Total Liability Shielded
$0
Coverage Tower
Excess
$500K
Primary
$250K
Retention
$100K
Monitoring...
See It In Action
What your underwriter sees
BROKER PORTAL
External Underwriter View
TOKEN: •••bk7x · READ-ONLY
Insurance Tower
Excess
$5M · 0% used
Primary
$2.5M · 0% used
SIR
$500K · 0% used
TOTAL LIABILITY SHIELDED (YTD)
$0
Benchmark Comparison
Governance Score
0
vs 580 avg
Risk Decay
0%
vs 45% avg
Policy Coverage
0%
vs 68% avg
ARS
0
RISK DECAY
0
VIOLATIONS / 30D
0
Structured
Loss Data
10K
Monte Carlo Runs
Live
Risk Scores
RMIS
Exports
Stop guessing what AI risk costs. Start measuring it.
Thirty minutes against your live underwriting questions. Leave with the Intervention Density data your actuaries actually need.
Trinitite
AI governance that catches mistakes, proves compliance, and shows the board what it saved—in dollars.
Product
Solutions
© 2026 Fiscus Flows, Inc. · All rights reserved
Accessibility
The Guardian Standard™