NEW · REPLAY LIVE: A CISO's Guide to Proving Agentic AI Governance
Watch
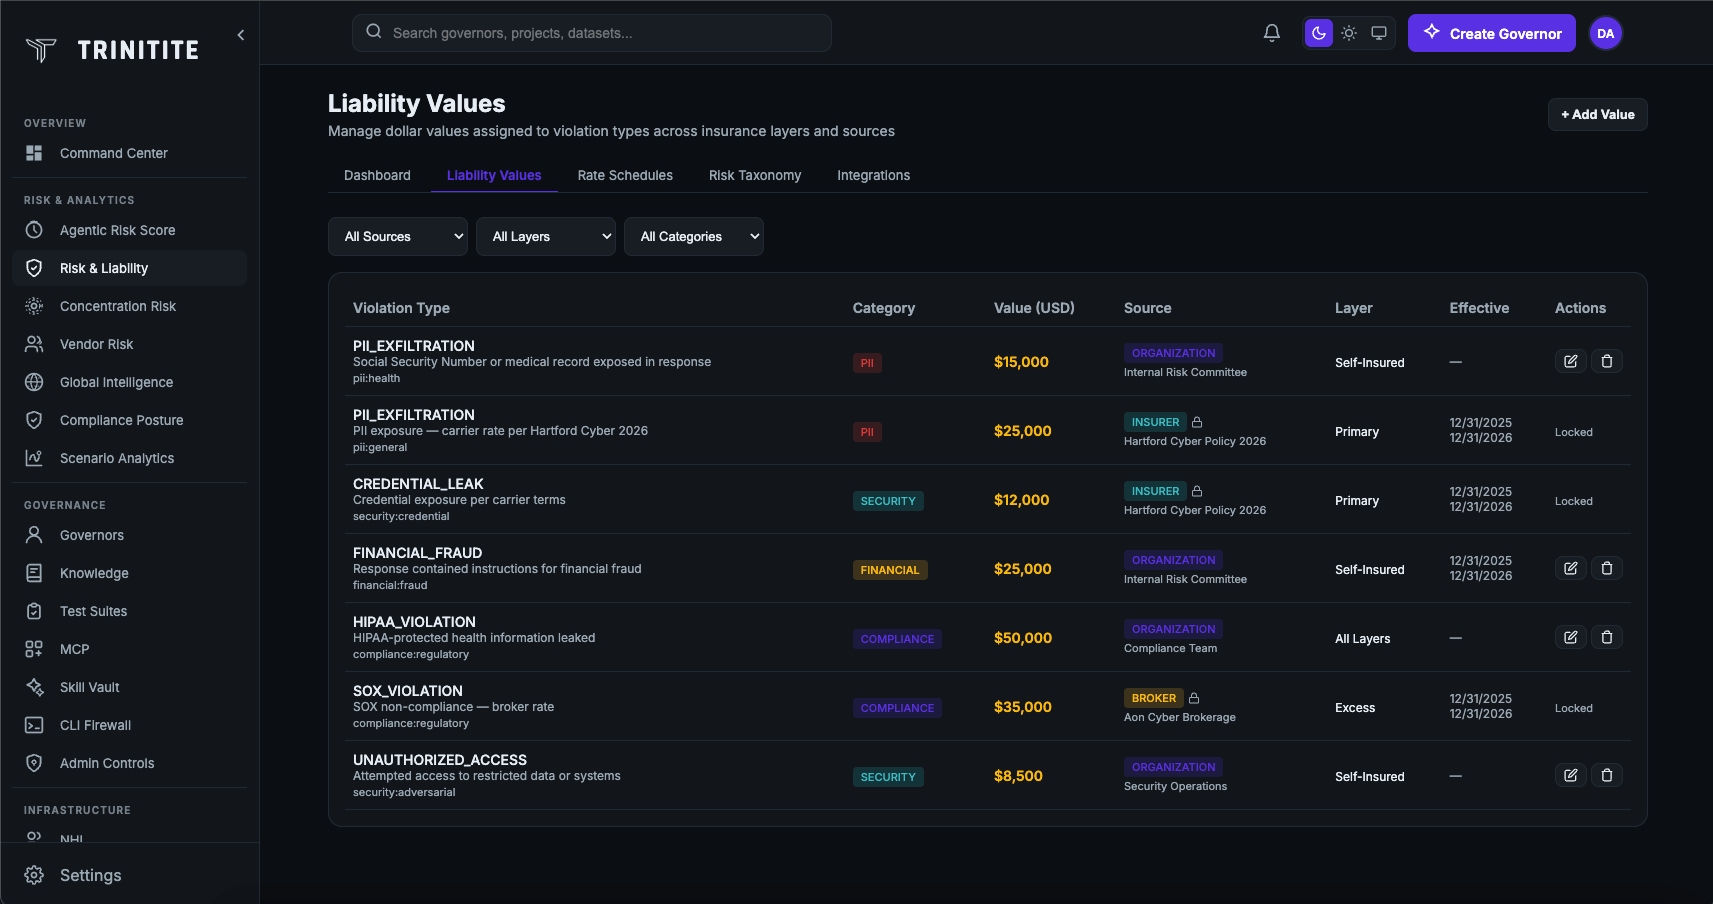
For CFOs
Turn hidden AI liability into measurable savings.
Every ungoverned AI action is a hidden cost. Trinitite makes it visible and shows you the ROI.
Your Problem
Sound familiar?
01
You can't put a dollar amount on AI risk. When the board asks about exposure, there is no number.
02
There is no clear return on governance spending. It feels like cost, not investment.
03
Audit prep takes weeks and eats up your team. Manual reviews are slow and never complete.
What You Get
Risk in dollars. Savings you can prove.
Executive Dashboard
Total liability shielded, governance ROI, VaR, and insurance position — all in one view tailored for the CFO. Board-ready numbers one click away.
Executive Dashboard
CEO
CFO
CISO
CRO
Governance ROI
15.2x
+2.1x
Liability Shielded
$2.8M
+$340K
ARS
712
+23
Industry Rank
Top 12%
↑ 4%
Every stakeholder gets their own view — same data, different lens.
ROI Attribution
Every dollar saved is traced to the rule that saved it. You know which policies deliver the most value — and you can prove it to the board.
Total Liability Shielded
$0
Coverage Tower
Excess
$500K
Primary
$250K
Retention
$100K
Monitoring...
Per-Governor ROI
See which AI governance investments deliver the most value. Compare governors side by side and prioritize spend where impact is highest.
Governor ROI
Customer Support Gov
Spend
$0/mo
Liability prevented
$0/mo
0.0x
ROI
Financial Ops Gov
Spend
$0/mo
Liability prevented
$0/mo
0.0x
ROI
Data Pipeline Gov
Spend
$0/mo
Liability prevented
$0/mo
0.0x
ROI
Total Portfolio ROI: $0 prevented / $0 spent = 0.0x
Monte Carlo Loss Modeling
10,000 "what if" runs show your most likely loss, worst case, and biggest gaps. Real math, not guesswork.
Monte Carlo Simulation — 10,000 Scenarios
Expected Annual Loss
$0
VaR (95%)
$0
CVaR (Tail Risk)
$0
Breach Probability
0.0%
Loss Distribution by Percentile
$0
P10
$0
P25
$0
P50
$0
P75
$0
P90
$0
P95
$0
P99
Mean
VaR 95%
Tail Risk
See It In Action
Where every dollar went
Each bar shows money saved or spent. Green means prevented loss. You see the full picture in one chart.
ROI Attribution
0.0x
ROI
Liability Prevented
$0
Premium Savings
$0
Compliance Avoided
$0
Productivity Saved
$0
Platform Cost
-$0
Net Value
$0
$167K
Shielded
15x
ROI
50%
Faster Audit Prep
$4.2M
Quantified Risk
Signed dollar exposure, every day
One number. Signed. Anchored.
Stream every AI chat through one URL. Get a signed pass rate and total dollar exposure each day. Take it straight to the board — no spreadsheets, no dashboards.
Sealed
Anchored
Drift · stable
psi 0.04
Sunday, May 31
One signed pass rate · for the whole UTC day
Events
0
Audited & signed
Pass rate
0.00%
0 cleared
Failed
0
Auto-routed to triage
Exposure
$0
Severity-weighted
Merkle root · daily envelope
The Three Layers
From one-time audit to underwriting-grade evidence.
Each layer adds new proof — and pays for the next one.
1
Layer 1 · Observe
Sampled Assurance
Audit a batch of past AI chats. Signed report in 72 hours.
2
Layer 2 · Monitor
Continuous Assurance
Stream every event. One signed pass rate per day. Drift alarms.
3
Layer 3 · Protect
Runtime Enforcement
Watch every AI action. Block, correct, or mask before harm ships.
See what AI risk costs — in real dollars.
Thirty minutes against your real agent spend. Leave with a captive-insurance-ready capital release model and a 90%+ OpEx arbitrage plan.
Trinitite
AI governance that catches mistakes, proves compliance, and shows the board what it saved—in dollars.
Product
Solutions
© 2026 Fiscus Flows, Inc. · All rights reserved
Accessibility
The Guardian Standard™